Date Program Tables updated: 08/18/2025
|
Program Disclosures |
|
|
Does the program or institution require students, trainees, and/or staff (faculty) to comply with specific policies or practices related to the institution’s affiliation or purpose? Such policies or practices may include, but are not limited to, admissions, hiring, retention policies, and/or requirements for completion that express mission and values? |
_____ Yes X No |
|
If yes, provide a website link (or content from brochure) where this specific information is presented: |
|
|
|
|
| Also, please describe or provide a link to program admissions policies that allow students to enter with credit for prior graduate work, and the expected
implications for time to completion:
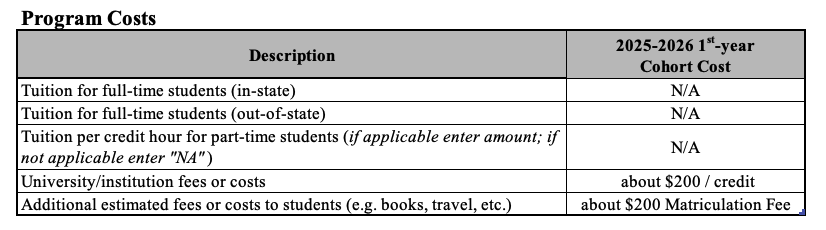
For a more detailed view of program costs, visit Fall 2025 Graduate Tuition and Fees.
|
|
||||||||||||||||